← Back to projects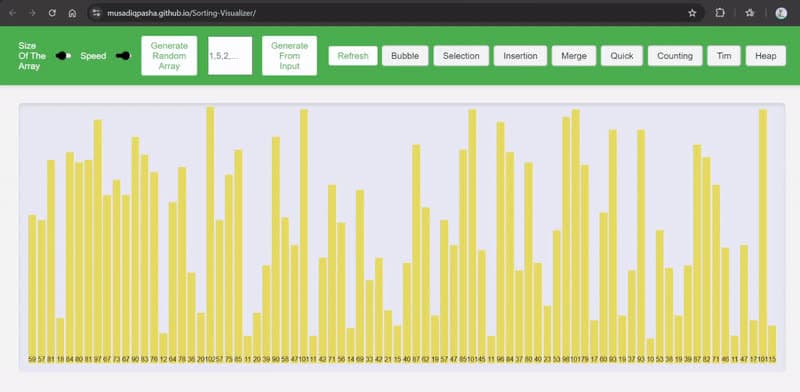
Algorithms covered
Sorting Visualizer
Watch eight sorting algorithms run, step by step, with their complexity on screen.
HTMLCSSJavaScript
The problem
Sorting algorithms are easy to memorise and hard to understand from code alone. The goal was a tool where you can see exactly what each algorithm does, at a speed you control.
Approach
- Visualises bubble, selection, insertion, merge, quick, heap, counting and tim sort.
- Uses colour for meaning: blue is default, yellow is being compared, red is out of place, green is in its final position.
- Lets users set the array size and speed, generate random arrays, or type their own comma-separated input.
- Shows best, average and worst time complexity and space complexity next to each run.
Results
- Eight algorithms in a single dependency-free web page.
- Live on GitHub Pages, so anyone can try it with no setup.
At a glance
| Algorithm | Average time |
|---|---|
| Bubble sort | O(n²) |
| Selection sort | O(n²) |
| Insertion sort | O(n²) |
| Merge sort | O(n log n) |
| Quick sort | O(n log n) |
| Heap sort | O(n log n) |
| Counting sort | O(n + k) |
| Tim sort | O(n log n) |
Standard average-case time complexity. The app also shows best, worst and space complexity for each.